Showing posts with label ZFS. Show all posts

Saturday, 22 October 2011

HP Microserver SAN in a box: Benchmarks

In my previous post, I detailed the build of my new "SAN" using an HP Microserver and the Nexentastor virtual storage appliance. Interested in knowing what the server was capable of, I installed the bonnie++ benchmarking software on the Nexenta VM and ran a number of tests to see how well it would perform as a datastore host for the VMware lab:

Each test was run four times and the average of each result taken. All testing was performed against a four disk RAIDZ parity stripe with an SSD read cache.

For the first test, the ZFS filesystem was configured sync=standard and compression=off. This resulted in the following averages:

  • Block Writes: 65MB/sec
  • Rewrites: 39MB/sec
  • Block Reads: 173MB/sec
  • Random Seeks: 451.55

For the second test, sync=standard and compression=on:

  • Block Writes: 148MB/sec
  • Rewrites: 107MB/sec
  • Block Reads: 218MB/sec
  • Random Seeks: 2036.1

As the results show, enabling compression results in a huge performance boost.

Although not recommended in situations where data integrity is important, ZFS supports the option of disabling synchronous writes. The third test was run with sync=disabled and compression=on:

  • Block Writes: 164MB/sec
  • Rewrites: 113MB/sec
  • Block Reads: 216MB/sec
  • Random Seeks: 2522.76

As expected, disabling synchronous writes improved the write performance of the server and had a corresponding knock-on effect for the rewrites. Block reads, although marginally slower than the second test, were close enough to suggest the difference was environmental.

Although running with synchronous writes disabled resulted in the highest performance, in order to get the best possible data integrity, I opted to run with sync=standard and compression=on.

While running the benchmark with compression=on, I noted in the vSphere client that both the CPU cores in the Microserver ran at nearly 100% (the Nexenta VM has 2 x vCPUs assigned). This suggests that the performance here was limited, not by the disks, but by the rather weak CPU in the Microserver.

Sunday, 18 September 2011

HP Microserver: Building a SAN in a box

[Update 05/2013: I've since migrated my Nexenta install to a dedicated server. See here for the details.]

Following a recent upgrade to my home lab, my storage now looks like this:
  • A unified SAN capable of providing both block (iSCSI) and file (NFS/CIFS) data.
  • Eight disks:
    • 2 x SSD
    • 6 x SATA
  • Two discrete RAID groups: 
    • a 400GB (usable capacity) two disk mirror
    • a 1.2TB (usable capacity) four disk parity stripe
  • Both RAID groups have dedicated 20GB flash read caches.
  • LUNs can be configured to support compression and/or deduplication
  • Copy on Write (COW) snapshots for all filesystems and LUNs
  • Support for replicating filesystems and LUNs to a second SAN

All sounds pretty funky. Must be expensive right?

Actually, the above is all achieved using a very cheap HP Microserver running VMware ESXi and the Nexenta virtual storage appliance. I've assigned the Nexenta VM 4GB RAM, but it would happily use more for it's L1 read cache.

The HP Microserver has 4 x SATA disks (2 x 1TB and 2 x 500GB) with a single 60GB SSD disk.

The Nexenta virtual machine is then assigned VMDK files. The first RAID group is a mirror: one VMDK file on SATA disks 1 and 2. The second RAID group is a RAIDZ parity stripe: one VMDK file on SATA disks 1, 2, 3 and 4. The flash read caches are 20GB VMDK files on the SSD.

The compression, deduplication, snapshot and replication features are provided by the ZFS filesystem.

This is a pictorial representation of the configuration:


And this is what it looks like physically:


Oops. No, that's the NetApp at work. But functionality-wise they are quite similar (obviously the vastly more expensive NetApp is much faster!).

This is the real physical hardware (on the far right, next to the ML110 and ML115):


Pretty small for such a setup. I've currently only got the built-in NIC in the Microserver, but will look at adding another to create a dedicated storage network.

Saturday, 22 January 2011

NexentaStor Community Edition: Troubleshooting the slow web interface

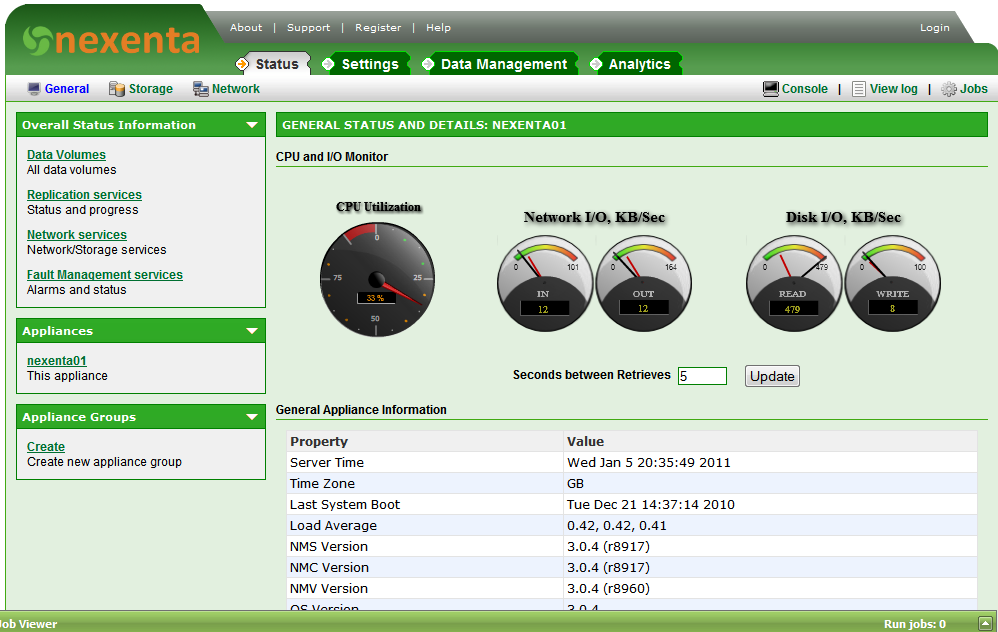
Although my experience with the NexentaStor Community Edition VSA has been largely positive, I found the web interface to be slow at times. I thought I'd do a bit of troubleshooting to see what was wrong...

The first step to troubleshooting is to get to a proper Unix prompt (remember that NexentaStor is built on the Solaris codebase). I opened an SSH session to the VSA and logged in as "admin". By default the admin shell is a bit special, and for real troubleshooting, we needed the root account. To get this, run the "su" command:

admin@nexenta01:~$ su
Password:
root@nexenta01:/export/home/admin#

Note that I ran "su" and not "su -".

VMware ESX admins may be familiar with "esxtop", and Linux admins with "top". The Solaris equivalent is "prstat":

   PID USERNAME  SIZE   RSS STATE  PRI NICE      TIME  CPU PROCESS/NLWP      
   877 root       36M   33M sleep   59    0   0:00:35 0.7% python2.5/15
  7312 root     4320K 3468K cpu0    59    0   0:00:00 0.4% prstat/1
   855 root       58M   26M sleep   59    0   0:00:33 0.3% nms/1
   196 root     7812K 4716K sleep   59    0   0:00:00 0.2% nscd/32
   576 root     6952K 4676K sleep   59    0   0:00:05 0.2% vmtoolsd/1
  3716 root       17M   15M sleep   44    5   0:00:04 0.1% volume-check/1
   596 root       39M 9092K sleep   59    0   0:00:00 0.1% nmdtrace/1
  7213 admin    7744K 5272K sleep   59    0   0:00:00 0.1% sshd/1
   953 root       58M   54M sleep   59    0   0:00:13 0.1% nms/1
  3560 root       16M   15M sleep   44    5   0:00:01 0.0% disk-check/1
  3564 root       18M   17M sleep   59    0   0:00:02 0.0% hosts-check/1
   434 root     3472K 2104K sleep   59    0   0:00:03 0.0% dbus-daemon/1
   324 root        0K    0K sleep   99  -20   0:00:02 0.0% zpool-testpool/136
     5 root        0K    0K sleep   99  -20   0:00:01 0.0% zpool-syspool/136
   509 root       18M   10M sleep   59    0   0:00:01 0.0% fmd/21
  1273 root       58M   54M sleep   59    0   0:00:05 0.0% nms/1
   392 root       13M 8400K sleep   59    0   0:00:00 0.0% smbd/18
   515 www-data   17M 6716K sleep   59    0   0:00:00 0.0% apache2/28
   234 root     2604K 1584K sleep  100    -   0:00:00 0.0% xntpd/1
  7231 root     4628K 2568K sleep   59    0   0:00:00 0.0% bash/1
   519 www-data   17M 6564K sleep   59    0   0:00:00 0.0% apache2/28
Total: 91 processes, 732 lwps, load averages: 0.55, 0.53, 0.55


When troubleshooting, I noticed that the process using the most CPU was "nms". This is a custom command provided by Nexenta. Curious to what this command was doing, I ran the truss command against the process id:

root@nexenta01:/export/home/admin# truss -f -p 855
855:    pollsys(0x08047AA0, 1, 0x08047B58, 0x00000000) (sleeping...)
855:    pollsys(0x08047AA0, 1, 0x08047B58, 0x00000000)    = 1
855:    read(4, " l01\00118\0\0\08D\0\0\0".., 2048)    = 176
855:    read(4, 0x0AB8DB78, 2048)            Err#11 EAGAIN
855:    stat64("/tmp/.nza", 0x0813E078)            = 0
855:    stat64("/tmp/.nza/.appliance", 0x0813E078)    = 0
855:    open64("/tmp/.nza/.appliance", O_RDWR)        = 9
855:    fstat64(9, 0x0813DFE8)                = 0
855:    fcntl(9, F_SETFD, 0x00000001)            = 0
855:    llseek(9, 0, SEEK_CUR)                = 0
855:    fcntl(9, F_SETLKW64, 0x08047410)        = 0
855:    llseek(9, 0, SEEK_CUR)                = 0


The truss command traces system calls and although the output appear quite scary, you can learn a lot about what a process is doing without needing to know what the system calls are doing. Useful calls to look for are:
  • open() - opens a file for reading/writing. The number returned (on the right after the = sign) is the file descriptor.
  • close() - closes a file.
  • read() and write() - the first number after the "(" is the file that is being read from or written to. Cross reference it with the open() call.
  • stat() and stat64() - tests to see if a file exists. Don't worry if you get errors returned here as it might be the process looking for a file that may existing in multiple places (e.g., when scanning the PATH for an executable).
The -f option in truss means that child processes will be "followed". So if the process you are tracing forks another process, you will get the data on the child process as well. The -p tells truss to trace the numbered process (obtained from ps or prstat output).

That was a really quick intro to truss for the purposes of explaining how I debugged the problem. Truss is capable of a lot more than I've just described. See the man page ("man truss") for more details.

Back to the performance problem...

The truss output showed me that the nms process was scanning through a lot of ZFS snapshots. There seemed to be a lot of these snapshots. I obtained a list of snapshots on the system:

# zfs list -t snapshot

...and got hundreds back! Something was creating a large number of snapshots. On closer inspection, it appeared I was getting a new snapshot of some filesystems every 7 minutes:

filestore/Shared@snap-daily-1-2011-01-21-2122     1.23M      -  50.5G  -
filestore/Shared@snap-daily-1-2011-01-21-2129     1.22M      -  50.5G  -
filestore/Shared@snap-daily-1-2011-01-21-2136     1.39M      -  50.5G  -
filestore/Shared@snap-daily-1-2011-01-21-2143     1.22M      -  50.5G  -
filestore/Shared@snap-daily-1-2011-01-21-2150     1.12M      -  50.5G  -
filestore/Shared@snap-daily-1-2011-01-21-2157     1.06M      -  50.5G  -
filestore/Shared@snap-daily-1-2011-01-21-2201     1.04M      -  50.5G  -
filestore/Shared@snap-daily-1-2011-01-21-2208     1.04M      -  50.5G  -
filestore/Shared@snap-daily-1-2011-01-21-2215         0      -  50.5G  -
filestore/Shared@snap-daily-1-latest                  0      -  50.5G  -


It appeared that the filesystems with the large number of snapshots were also the filesystems that I had set to replicate to my second VSA using the auto-tier service. As a test, I listed all the auto-tier services and disabled the suspects:

root@nexenta01:/# svcs -a | grep auto-tier
online         20:33:40 svc:/system/filesystem/zfs/auto-tier:filestore-Software-000
online         20:33:41 svc:/system/filesystem/zfs/auto-tier:filestore-ISOs-000
online         20:33:42 svc:/system/filesystem/zfs/auto-tier:filestore-Shared-000
online         21:33:24 svc:/system/filesystem/zfs/auto-tier:filestore-Home-000
root@nexenta01:/# svcadm disable svc:/system/filesystem/zfs/auto-tier:filestore-Home-000
root@nexenta01:/# svcadm disable svc:/system/filesystem/zfs/auto-tier:filestore-Shared-000


The snapshots stopped.

To determine if the number of snapshots was the problem (I'd seen similar problems before), I destroyed all the snapshots for that filesystem:

root@nexenta01:/# for snapshot in $(zfs list -t snapshot | grep Home | grep snap-daily-1-2011-01 | awk '{ print $1 }'); do zfs destroy $snapshot; echo "Destroyed $snapshot"; done


The web interface performance was fast.

Okay, so that was the problem, but why was it happening? At first, I couldn't work it out and deleted and recreated the auto-tier jobs. Everything then worked fine... for a couple of days. Then the number of snapshots increased again.

This time I was able to identify a change in the configuration. I had had to reboot the second VSA because it had run out of memory (I assigned too little). This appears to have caused the link between the two to have been broken and the auto-tier jobs were running out of control.

Knowing that a new snapshot would fire every 7 minutes, I waited and ran the "ptree" command (shows the list of processes in a tree view showing the parent/child relationships) until I spotted the auto-tier job:

  2260  sh -c /lib/svc/method/zfs-auto-tier svc:/system/filesystem/zfs/auto-tier:filest
    2266  /usr/bin/perl /lib/svc/method/zfs-auto-tier svc:/system/filesystem/zfs/auto-tie
      2315  rsync -e ssh --delete --exclude-from=/var/lib/nza/rsync_excl.txt --inplace --ig
        2316  ssh nexenta02.local.zone rsync --server -lHogDtpre.isf --delete --ignore-errors


The problem here was the zfs-auto-tier service (process 2260). Although the full command is truncated, I compared it with the output from svcs (see above) and guessed it to be:

sh -c /lib/svc/method/zfs-auto-tier svc:/system/filesystem/zfs/auto-tier:filestore-Home-000

To examine the properties of this service, I ran:

root@nexenta01:/# svccfg -s svc:/system/filesystem/zfs/auto-tier:filestore-Shared-000 listprop
zfs                                application
zfs/action                         astring 
zfs/day                            astring  1
zfs/depth                          astring  1
zfs/dircontent                     astring  0
zfs/direction                      astring  1
zfs/exclude                        astring 
zfs/from-fs                        astring  /volumes/filestore/Shared
zfs/from-host                      astring  localhost
zfs/from-snapshot                  astring 
zfs/fs-name                        astring  filestore/Shared
zfs/keep_days                      astring  7
zfs/method                         astring  tier
zfs/minute                         astring  0
zfs/options                        astring  "--delete --exclude-from=/var/lib/nza/rsync_excl.txt --inplace --ignore-errors -HlptgoD"
zfs/proto                          astring  rsync+ssh
zfs/rate_limit                     astring  0
zfs/to-fs                          astring  /volumes/backup
zfs/to-host                        astring  nexenta02.local.zone
zfs/trace_level                    astring  1
zfs/type                           astring  daily
zfs/retry-timestamp                astring  1295492474
zfs/period                         astring  1
zfs/hour                           astring  2
zfs/last_replic_time               astring  12
zfs/time_started                   astring  21:43:18,Jan21
zfs/retry                          astring  1
startd                             framework
startd/duration                    astring  transient
general                            framework
general/enabled                    boolean  true
start                              method
start/exec                         astring  "/lib/svc/method/zfs-auto-tier start"
start/timeout_seconds              count    0
start/type                         astring  method
stop                               method
stop/exec                          astring  "/lib/svc/method/zfs-auto-tier stop"
stop/timeout_seconds               count    0
stop/type                          astring  method
refresh                            method
refresh/exec                       astring  "/lib/svc/method/zfs-auto-tier refresh"
refresh/timeout_seconds            count    0
refresh/type                       astring  method
restarter                          framework    NONPERSISTENT
restarter/auxiliary_state          astring  none
restarter/logfile                  astring  /var/svc/log/system-filesystem-zfs-auto-tier:filestore-Shared-000.log
restarter/start_pid                count    867
restarter/start_method_timestamp   time     1295642022.247594000
restarter/start_method_waitstatus  integer  0
restarter/transient_contract       count  
restarter/next_state               astring  none
restarter/state                    astring  online
restarter/state_timestamp          time     1295642022.255217000


The property that stood out was zfs/retry-timestamp and I guessed the value was a timestamp counting in seconds since the epoch. Converting the value turned it into a human-readable date:

Thu Jan 20 2011 03:01:14 GMT+0000 (BST)

This date was in the past, so was the script running because of this?

I editing the value:

svccfg -s svc:/system/filesystem/zfs/auto-tier:filestore-Home-000 setprop zfs/retry-timestamp=0

And waited...

No new snapshot was created!

I assume this a bug. The temporary failure of the second device should not cause the primary VSA to run amok! Fortunately, this fix appears to have worked and the auto-tier service is now working correctly. The web interface is also performing as expected!

Tuesday, 18 January 2011

NexentaStor Community Edition: Compression and Deduplication Benchmarks

If you read my previous post on benchmarking the NexentaStor VSA and want even more benchmarking information, this post is for you!

ZFS filesystems can be configured to support compression, and in the later releases, deduplication. While both these features are useful in maximising the use of disk space, what is the impact on performance running with these options configured?

The base configuration of the appliance is the same as test 4 from the previous configuration: A mirrored pair of SATA disks, with a SSD L2ARC. The filesystem is configured to use the ZFS Intent Log (ZIL) for synchronous operations (the default) but a separate log is not configured.

The performance data for the base configuration is:
  • Sequential Block Reads: 59934K/sec (58.5MB/sec)
  • Sequential Block Writes: 28793K/sec (28.1MB/sec)
  • Rewrite: 17127K/sec (16.7MB/sec)
  • Random Seeks: 517.45/sec
The benchmark will use bonnie++ running on a Solaris 11 Express VM connecting to the NexentaStor appliance over an internal vSwitch. The bonnie++ command line is:


# /usr/local/sbin/bonnie++ -uroot -x 4 -f -s 4096 -d /mnt


See the previous blog post for an explanation of these options.

Test 1: Set compression=on

Enabling compression for a specific filesystem is very simple:

# zfs set compression=on testpool/testing

The results of the test were:
  • Sequential Block Reads: 52830K/sec (51.5MB/sec)
  • Sequential Block Writes: 38811K/sec (37.9MB/sec)
  • Rewrite: 18659K/sec (18.2MB/sec)
  • Random Seeks: 1188.95/sec

Reads were lower with compression enabled, but writes and rewrites were faster. Random seeks are much faster, but I cannot explain that, although suspect that if the bonnie++ data is highly compressible, this may cause "odd" results such as this.

Test 2: Set deduplication=on

For this test, compression was turned off and de-duplication turned on:

# zfs set compression=off testpool/testing
# zfs set dedup=on testpool/testing

The results of the test were:

  • Sequential Block Reads: 45806K/sec (44.7MB/sec)
  • Sequential Block Writes: 27550K/sec (26.9MB/sec)
  • Rewrite: 15179K/sec (14.8MB/sec)
  • Random Seeks: 464/sec
This shows that there is a performance penalty for enabling data deduplication. There is also a RAM overhead as the operating system needs to store the dedupe table in memory (not measured as part of this test).


Test 3: Set compression=on, deduplication=on


For this test, both compression and de-duplication were turned on:

# zfs set compression=on testpool/testing
# zfs set dedup=on testpool/testing

The results of the test were:
  • Sequential Block Reads: 53844K/sec (52.5MB/sec)
  • Sequential Block Writes: 34315K/sec (33.5MB/sec)
  • Rewrite: 17654K/sec (17.2MB/sec)
  • Random Seeks: 1331/sec
These results suggest that if deduplication is required (to save space), then the additional overhead of compression improves both the read and write performance. As with compression turned on, random seeks are improved significantly.

Conclusion

In conclusion, for maximum read performance, do not turn on compression or deduplication. For maximum write and rewrite performance, turn on compression. If deduplication is required, consider turning on compression as well as this improves dedupe performance. There is a CPU and memory overhead using these features, but as with most things, it's a case of balancing the cost vs the benefit.

Friday, 14 January 2011

NexentaStor Community Edition: Benchmarking

In a previous post I discussed how I implemented a Virtual Storage Appliance (VSA) on my VMware home server running the NexentaStor Community Edition operating system. While getting everything working was fairly straightforward, knowing how well it was running required some benchmarking.

I've used the bonnie++ benchmark program before and generally like the way it works. Although I suspect  most of this testing could be done through the web interface (setting up the disks etc.), I found it easier and quicker to use the command line and the Solaris commands.

For the test, I create a new VMDK (20GB) on my primary SATA drive and published it to the VSA. I then created a new pool and added the disk:

# zpool create testpool c1t5d0

I then created a filesystem in the pool:

# zfs create testpool/testing

For this testing, I did not enable compression or deduplication (perhaps a topic for another day...).

I ran the bonnie++ benchmark with the following command line:

#  /usr/local/sbin/bonnie++ -uroot -s 8192 -d /testpool/testing

The size (8192) tells bonnie++ to create test data that is 8GB in size. This is twice the RAM allocated to the VM, so prevents the results being skewed by using data cached in memory. I then ran each test 4 times and averaged the results. No other significant activity was taking place while the tests were running. To provide a consistent environment, I used CPU and memory reservations for the VM. I opted to focus on the sequential block reads, sequential block writes (ZFS buffers random writes and writes them sequentially), rewrite and random seek performance. A good guide to understanding bonnie++ output in a ZFS contact can be found here.

Test 1: One SATA based disk

This is the basic starting point: One disk in the pool:
  • Sequential Block Reads: 75492K/sec (73.5MB/sec)
  • Sequential Block Writes: 61966K/sec (60.5MB/sec)
  • Rewrite: 26873K/sec (26.2MB/sec)
  • Random Seeks: 278.8/sec

Test 2: Mirrored SATA disks

I added a second VMDK to the NexentaStor VM locating it on the second SATA disk. The new disk was then added to the test pool as a mirror. Once the resilvering was complete, the test was re-run:
  • Sequential Block Reads: 76141K/sec (74.3MB/sec)
  • Sequential Block Writes: 52331K/sec (51.1MB/sec)
  • Rewrite: 31525K/sec (30.7MB/sec)
  • Random Seeks: 292.6/sec
So we can see that in a mirrored configuration, block reads are marginally faster, block writes are slower, rewrites of existing blocks is faster and the number of random seeks has increased. I was a bit surprised that the block read was not much higher given that running a "zpool iostat" on the test pool shows that the read load is balanced across both disks. The slower writes are no surprise as the kernel has to write the same data to two separate devices.

Test 3: Mirrored SATA disks with SSD L2ARC

I added another VMDK to the NexentaStor VM locating it on the SSD datastore. The new disk was added to the test pool as a cache device, implementing a L2ARC:
  • Sequential Block Reads: 116837K/sec (114MB/sec)
  • Sequential Block Writes: 65454K/sec (63.9MB/sec)
  • Rewrite: 37598K/sec (36.7MB/sec)
  • Random Seeks: 440/sec
The L2ARC has improved the read performance significantly, and surprisingly the write performance is faster too (not sure why this is because the L2ARC is a read-only cache). Rewrite is a bit faster and random seeks is much higher (to be expected with an SSD).

So at this point, we have a pretty good idea what the performance of the NexentaStor appliance is writing to local disk. The next test is to see what the performance is like over NFS...

Test 4: NFS test from Solaris 11 Express VM

The Solaris 11 Express VM is running on the same host and is connected to the VSA by the same vSwitch.

The mount operation was performed by running:

# mount -F nfs nexenta01:/testpool/testing /mnt

The bonnie++ command was:

# /usr/local/sbin/bonnie++ -uroot -x 4 -f -s 4096 -d /mnt

The size of the testing dataset was reduced from the 8192MB on the VSA because the Solaris 11 Express VM only has 2GB of RAM and 4096MB is enough to ensure the VM isn't caching the data in its RAM. It's less than the RAM in the VSA, but at this point we're interested in the performance over the network to clients, not the speed of the appliance itself.

The default behaviour for Solaris NFS is to perform synchronous writes (see my last blog post for a quick primer on NFS/ZFS interactions). Using the zilstat script, I was able to confirm that the ZIL was written to during the benchmark run, proving that the write operations were indeed synchronous. As expected, performance was much worse:
  • Sequential Block Reads: 59934K/sec (58.5MB/sec)
  • Sequential Block Writes: 28793K/sec (28.1MB/sec)
  • Rewrite: 17127K/sec (16.7MB/sec)
  • Random Seeks: 517.45/sec
Of course, the network stack will be an overhead, but it's worth seeing if we can improve on these times...

Test 5: NFS test from Solaris 11 Express VM, sync=disabled on NexentaStor NFS server

The ZIL is used in ZFS to log synchronous writes to a secure place before writing the data to the pool. The NFS client will wait until the server has confirmed the write to the ZIL before continuing processing. Very good for secure data, but does slow things down. The ZFS sync=disabled option bypasses the ZIL and buffers the request in the server's RAM until it is commited to disk. In real world terms, it's more unreliable, but it's about the same as other non-ZFS based NFS servers such as Linux.

The command to disable synchronous writes (on a per-filesystem basis), is:

# zfs set sync=disabled testpool/testing

The tests were then re-run:

  • Sequential Block Reads: 69438K/sec (67.8MB/sec)
  • Sequential Block Writes: 49177K/sec (48MB/sec)
  • Rewrite: 20737K/sec (20.2MB/sec)
  • Random Seeks: 520.9/sec
As the test ran, I monitored the ZIL utilisation using zilstat and confirmed that the ZIL was not being used. The results show a significant improvement in writes of approximately 20MB/sec and a smaller improvement in rewrites.


Test 6: NFS test from Solaris 11 Express VM, sync=standard, separate slog on NexentaStor NFS server

Disabling the ZIL improved NFS performance, but what would happen if the ZIL was placed on a separate SSD disk? To do this, I created a new disk from the SSD datastore and attached it to the pool:

# zpool add testpool log c1t4d0

I changed the sync property back to standard (re-enabling synchronous writes) and ran the tests, using zilstat to confirm that the ZIL was being written to:
  • Sequential Block Reads: 55142K/sec (53.8MB/sec)
  • Sequential Block Writes: 23931K/sec (23.3MB/sec)
  • Rewrite: 16518.5K/sec (16.1MB/sec)
  • Random Seeks: 628.1/sec
Well this was unexpected! The separate ZIL has produced worse results than using the pool SATA disks writing the data twice! The surprising drop in performance may be due to the type of SSD I'm using (OCZ Vertex 2). This is a Multi Level Cell (MLC) type device which is optimised for read operations (most consumer SSDs are MLC). For high performance writes, Single Level Cell (SLC) SSDs are recommended, but they are far more expensive.

Conclusion

To wrap this up then, there are two options to consider when running NFS on ZFS:

  1. Enable the ZIL, experience slower performance but know the data is secure
  2. Disable the ZIL, experience faster performance but understand the risks
The "best" option depends on the environment the VSA is serving. Fortunately the ZIL can be turned on or off on a per-filesystem basis. This means that non-critical test lab VMs can sit on a filesystem with no ZIL for maximum performance, while critical data (e.g., family photos/videos and the copy of your tax return) can be configured with end-to-end consistency.

If you are running a VMware home lab and are looking for a decent virtual storage appliance, NexentaStor CE is definitely worth a look, and as you can see, has plenty of features!

Thursday, 13 January 2011

Understanding NFS and ZFS interactions

This post was originally going to document the benchmarking of my NexentaStor VSA. Although most of this work has been done (and will be posted soon - promise!), the results were somewhat confusing and required me to dive into the guts of how Solaris (on which NexentaStor is based) handles filesystem operations and NFS. This might be useful if you are trying to debug some performance issues:

ZFS is designed so that all writes are transactional. A write is either successful and the data is written to disk, or it fails and no data gets written. This means that the data on-disk is always consistent.

From an application's perspective, there are two types of write operations to a POSIX compliant filesystem: asynchronous and synchronous.

An asynchronous write passes the data to the filesystem and then continues, effectively assuming that the data is safe. In comparison, a synchronous write passes the data to the filesystem and then waits until the filesystem acknowledges that the data is safe.

Asynchronous Writes


Synchronous Writes


The difference can be seen in what happens if the filesystem or server has a problem (e.g., power fail). In an asynchronous write, the data may only be buffered in RAM and is therefore lost, although the application believes it is safe. With synchronous writes, the data will be definitely be safe because the filesystem only reports back to the application when it is definitely written.

So while the ZFS on-disk data is consistent, it's possible, using asynchronous writes, to lose data in transit. For synchronous writes, ZFS uses a feature called the ZFS Intent Log (ZIL).

When a synchronous write request is made to the filesystem, the data is first written to the ZIL. This ensures the data is safe on disk and the application is free to continue. ZFS will then flush the contents of ZIL to the filesystem at a specified interval (roughly every 5 seconds).

By default, the ZIL is allocated disk blocks from the pool. This leads to a situation where data is written to disk twice, once to the ZIL and secondly to the actual filesystem. This double writing can slow things down.

One option to speed things up is to use a Separate Log (SLOG in ZFS terminology) on which to locate the ZIL. This is typically a flash/SSD drive. Synchronous writes can be logged quickly to the SLOG and then written to slower disk later, speeding up the response to the application. When using a SLOG, the recommendation is to use a mirrored ZIL to ensure that the data is truly safe before being committed to disk.

Synchronous Writes with separate ZIL


How does this impact on NFS?

It is common for an NFS client to write synchronously to an NFS server in order to get an acknowledgement that the data is safely committed to disk. This means that an NFS server with a ZFS filesystem will be performing ZIL writes and come with the associated overheads. This also means the NFS client will be blocked until it receives an acknowledgement back from the server. This can result in "poor performance" when running ZFS and NFS together.

NFS with synchronous writes

There are a couple of options that can speed things up:

The NFS client may opt to mount the filesystem asynchronously. This means that the data will sit in the server's RAM buffers until a transaction group commit and is therefore vulnerable to power failure. NFS clients mounting asynchronously may therefore lose data.


Another option is to disable the ZIL on the NFS server. This effectively makes all synchronous writes asynchronous from the ZFS perspective. Again, data in transit may be lost. Recent versions of ZFS refer to this as sync=standard (default, synchronous writes are written to the ZIL), sync=always (paranoid, everything is written synchronously) or sync=disabled (makes all writes asynchronous).

NFS with async or ZIL disables


Whether NFS async or disabling the ZIL is a risk worth taking depends on the nature of your data. VMware vSphere appears (based on my reading which I'm assuming to be true) to use synchronous writes when using NFS datastores, which can impact on performance. Applying some of the tuning detailed above may help improve performance in a virtual environment.

Wednesday, 5 January 2011

NexentaStor Community Edition - first impressions

During the Christmas break I took the opportunity to upgrade my HP ML110 G5 from the sadly future-less OpenSolaris to another platform. I opted to turn it into a VMware ESXi 4.1 install to run alongside my existing HP ML115 G5 lab server.

The ML110 G5 was fitted with 2 x 1TB SATA drives and a 60GB SSD drive. All three were presented as datastores to ESXi.


For file and block level storage, I opted to use NexentaStor Community Edition. This operating system is derived from the OpenSolaris code base and builds on many Solaris technologies, including ZFS. The enterprise version is pay-for, but the free Community Edition supports datasets up to 18TB, which is easily enough for a home lab environment.


I installed NexentaStor CE on a fairly small volume and created a larger (400GB) VMDK which I then added to the ZFS pool. I assigned 4GB of RAM to the VM, the majority of which will be used as the ARC cache (see below for details).

A (brief) ZFS Primer

In ZFS, physical disks are grouped together in pools. Writes to a pool are striped across all disks in the pool by default, but disks within the pool can be mirrored to each other, or configured in parity RAID comprising of one, two or three parity disks (called RAIDZ, RAIDZ2 and RAIDZ3 respectively) to provide additional resilience.

ZFS filesystems are created from space in the pool and can have many properties applied including size reservations, quotas, compression and deduplication. Filesystems can be shared over NFS, CIFS, or both concurrently.

In addition to ZFS filesystems, Zpools can also contain Zvols. These are basically ZFS filesystems without the filesystem formatted. Zvols provide many of the same properties as a ZFS filesystem including compression and deduplication. Zvols can be shared over iSCSI and formatted by the initiator to hold a server's native filesystem (such as VMFS, NTFS, Ext3, HFS+ etc.).

NexentaStor CE VSA data integrity

With a single 400GB VMDK created and assigned to the VM, I create a new zpool (called Datasets by Nexenta and configured through the web interface - command line mojo not required) and started creating new ZFS filesystems (called Shares, one to hold software installers, another for ISO images, a third for documents etc.).

Obviously a single disk is no good if there is a problem with the underlying drive, so I created a second 400GB VMDK on the other physical disk and presented it to the appliance (all disk rescanning is done without a reboot necessary). The second 400GB was then added to the zpool as a mirror. The process of copying data from the original disk to the mirror is called resilvering and can take some time.

This mirroring is within the VSA and will not help if the primary disk fails as the VM configuration files and boot VMDK are not mirrored. So why mirror the data?

ZFS stores a checksum for the data it writes and when configured in a mirror or RAID-Z, the filesystem is able to reconstruct the data in the event of disk write errors using the redundant data. See here for more information on the end-to-end checksumming and data integrity.

This means that while the VSA will not survive the primary disk physically dying, any corruptions that occur as a disk starts to die will be caught and corrected. A scheduled housekeeping job called a scrub runs weekly to ensure the checksums and data are correct.

NexentaStor CE VSA performance tuning

SATA disks are slow and SSD is fast. Unfortunately SSD is much more expensive than SATA. While one option is to put performance critical data on the SSDs and less important VMs on SATA, the alternative is to use flash disk as cache.

ZFS utilises an in-memory cache called the "Adaptive Replacement Cache" (ARC). This is very fast (being in RAM) and speeds up disk reads, but is limited to the physical memory in the machine (approximately 3GB in a 4GB VM). However, ZFS can support two additional caches: The L2ARC (Level 2 Adaptive Replacement Cache) and ZIL (ZFS Intent Log). The L2ARC is designed to speed up reads, while the ZIL speeds up metadata writes. The best practice for creating a ZIL is to use mirrored flash drives on devices separate from the L2ARC, but as I only had one SSD, I opted to create a single L2ARC.

The L2ARC was created as a 20GB VMDK disk on the SSD datastore and added to the VM. The new volume was then added to the zpool as a cache device. While 20GB is not huge in terms of disk, it represents a significant amount of cache memory.


The performance advantages of the cache are not immediately obvious given that it takes time for the cache to populate. However, once data has been read, future reads will be taken from SSD instead of SATA. I've not had the chance to do meaningful benchmarks yet, but plan to do so soon.

NexentaStor CE VSA snapshots and replication

On top of the data resilience provided by the checksum, ZFS supports copy-on-write snapshots. These can be automatically scheduled on a per-filesystem basis to provide a point in time snapshot. This can be configured so document data is snapshotted daily (or hourly), while more static data such as the ISO store taken weekly or monthly.


The final step was to add even more resilience to the configuration. For this, I created a second NexentaStor CE VM on my HP ML115 G5 lab machine. This VM is smaller with only 1GB RAM. I created a 400GB disk but did not bother with mirroring. Using the NexentaStor web interface, I paired the machines and configured some scheduled jobs to replicate specific filesystems from the primary VSA to this secondary VSA (using snapshot copies over SSH). Nexenta refers to this as a "tiering service". This means that in the event the original server dies, the important data will still be available.


Overkill? Perhaps, but part of this work was to see what could be done with ZFS and the result is a very powerful storage setup.

There are a couple of concerns. One surrounds the longterm viability of ZFS given the Oracle takeover. Although NetApp have settled with Oracle, I don't know if the agreement covers other users of ZFS. Secondly, there will be a performance overhead by running the NexentaStor CE as a VSA on top of the ESXi storage subsystem. While it might be possible to squeeze a bit more performance by running NexentaStor CE directly on the bare-metal, ESXi allows me to run a few other VMs alongside the VSA. The trade-off is worth it in my mind.

In summary, NexentaStor Community Edition is a very powerful piece of software (and this post only scratches the surface - no mention of its AD integration, iSCSI functionality etc.) that gives some high-end functionality *for free* and is certainly worth considering for your home lab.

Wednesday, 22 December 2010

Home network update

My home network has been faithfully served by an installation of OpenSolaris on my HP ML110 G5. Unfortunately Oracle's actions towards the open source community have sadly killed what was an excellent project. While there is a small hope that the Illumos folks might get a fork organised, remaining on OpenSolaris was not practical.

To replace OpenSolaris, I would need an environment that provided all the features I was currently running. This meant I needed a CIFS and NFS server, iSCSI target server, internal DNS server, CUPS print server, private IMAP server (for my old pre-Gmail mail archive) and Windows 7 virtual machine courtesy of VirtualBox. Yeah, OpenSolaris was a *very* capable platform.

The solution I opted for was to turn the ML110 G5 into another VMware ESXi server, running a number of virtual machines the provide the above services. I would also take this opportunity to fix a couple of niggling problems with the way it was setup.

This change coincided with a number of new purchases for the home network:
  • Acer Revo Aspire
  • Netgear ReadyNAS Duo
  • OCZ Vertex 2 SSD
The Acer Revo was bought because I was fed up with using Windows 7 over RDP on the Mac. Little issues like the backslash key not working with a UK keyboard (sounds trivial, but you try using Windows seriously without entering backslash) meant I wanted something I could connect to directly via my KVM. The Revo won't win any awards for high performance, is a capable enough machine (with 2GB RAM) and can run a number of apps (including the vSphere client and Office 2010) without any problems.

I bought the Netgear ReadyNAS Duo after looking at some of the alternatives. I was originally tempted by the Iomega ix2-200d, but was put off by the fact the filesystem is proprietary and requires you to send the unit back if there is a problem. In contrast, the ReadyNAS Duo uses Ext3, but the real dealmaker was an offer to get a second 1TB disk *for free* (via mail-in coupon). My initial playing with this unit has been positive and it's nice and quiet, but I've not spent a huge amount of time with it yet.

The OCZ Vertex 2 SSD (60GB) was purchased because I wanted to experiment with the NexentaStor [Community Edition] virtual storage appliance. Built on top of the open-sourced Solaris codebase, Nexenta have built a storage solution around ZFS. Although the SSD is pretty small for a disk, it can be added as an "L2ARC" (Level 2 Adaptive Read Cache) to boost performance. This will require a block post of it's own to detail.

Finally, although I am not pleased with the way that Oracle have gutted Sun, the Solaris operating system remains excellent and I will be using it in my work for the foreseeable future. The preview release of Solaris 11 Express demanded a look.

I'll be blogging about some of these developments in future posts, coming soon...

Saturday, 16 January 2010

OpenSolaris: Very slow boot times

Today I lost power to my servers due to a power outage. The UPS wasn't up to coping and almost instantly died (I was running five computers on the one, small UPS...).

Booting the OpenSolaris server back up reminded me of the painfully slow boot times that can occur. We're talking *hours* to get the server up.

The reason for this is due to the number of ZFS snapshots on a system. Here's the experiment:

I booted off the OpenSolaris 2009.06 CD and ran the format command. This displayed the disks on the system. I then imported the zpools into the running installation:

# zpool import rpool -f
# zpool import datapool -f

The -f is required because the system thinks the zpools have been assigned to another server (useful if the zpool is on a SAN LUN). The first command was relatively quick, the second was much, much slower.

Running prstat revealed that devfsadm was consuming an entire CPU. The purpose of devfsadm is to dynamically add and remove devices on the system. It was stating each of the snapshots in the datapool and creating entries in /dev. After running for a few hours, it had created over 4000(!) devices in /dev/zvol/dsk/datapool and /dev/zvol/rdsk/datapool.

The number of snapshots is thanks to the automatic snapshot service which takes frequent snapshots of the filesystems in the pool. This list is not automatically cleared down, so can grow huge. Not a problem usually because the uptime of OpenSolaris is fantastic, but is a real pain when you need the server to boot.

So, in order to keep your OpenSolaris boot times down, keep an eye on the number of snapshots on your system.

Tuesday, 20 October 2009

Building a ZFS filesystem using RAID60

We are starting to use ZFS as a production filesystem at $WORK. Our disk array of choice is the Sun StorageTek 2540 which provides hardware RAID capabilities. When building a ZFS environment, the decision has to be made on whether to use the hardware RAID and/or the software RAID capabilities of ZFS.

Having watched Ben Rockwood's excellent ZFS tutorial, my understanding of ZFS is much better than before. For our new fileserver, I've created the following:

On the StorageTek 2540, I've created two virtual disks in a RAID6 configuration. Each virtual disk comprises of 5 physical disks (3 for data, 2 for parity) and is assigned to different controllers. On top of each virtual disk, I've created a 100GB volume. This is published as a LUN to the Solaris server and appears as c0d3 and c0d4.

Each LUN is then added to a zpool called "fileserver":

# zpool create fileserver c0d3 c0d4

By default, ZFS treats the above in a variable width stripe, so the hardware and software combined result in a "RAID60" configuration; data is striped across 2 x RAID6 virtual disks for a total width of 10 spindles.

Why RAID6 and not RAID10? Apart from the cost implications, as a fileserver, the majority of operations will be read-only and RAID6 is very good at reads (while being less-good at writes).

Now, when I'm running out of space, I can create a new volume, publish the LUN and add it to the zpool:

# zpool add fileserver c0d5

A quick check of the zpool status shows the disk is added successfully:

# zpool status
pool: fileserver

state: ONLINE

scrub: none requested

config:

NAME STATE READ WRITE CKSUM

fileserver ONLINE 0 0 0

c0d3 ONLINE 0 0 0

c0d4 ONLINE 0 0 0

errors: No known data errors

Running zpool list reports the newly added space is available:

# zpool list
NAME SIZE USED AVAIL CAP HEALTH ALTROOT
fileserver 199G 69.4G 130G 34% ONLINE -


All told, very simple to do and results in a pretty fast filesystem.

Sunday, 13 September 2009

SAN/NAS upgrade

All of my important data is stored on my OpenSolaris storage server (an HP ML110 G5). A mirrored pair of 500GB in a ZFS Zpool provided NFS, CIFS and iSCSI sharing. Unfortunately, I ran out of space to the point that ZFS was unable to take snapshots.

I needed to add more storage, but didn't have the drive bays available to do it. So I ordered two 1TB SATA disks with the intention of replacing the two existing disks.

I followed the instructions found at Blog O Matty (a blog I highly recommend). The process was extremely easy:
  1. Remove one of the 500GB disks and replace with a 1TB disk.
  2. Tell ZFS to "resilver" (aka resync the mirror) the new disk (one command: zpool replace datapool c3d0)
  3. Wait a number of hours for the disk to resilver (10 hours when the disks are being used)
  4. Tell ZFS to clear all error status messages (zpool clear datapool). This puts the pool into an "ONLINE" state for all devices in the pool.
  5. Remove the second 500GB and replace with the second 1TB disk
  6. Tell ZFS to resilver onto the second disk
  7. Wait for this second disk to resilver. I did this overnight and it was finished in the morning.
  8. Tell ZFS to clear the error status on the new disk
  9. Check the zpool status (zpool list) and note the new size: Now 928GB
The ML110 does not have hot-swap disks, so I needed to power off each time I swapped the disks, but if you have a hot swap capable server, the entire process can be done live with the filesystems mounted. Nice.

With approximately another 500GB free space, I can now experiment with other hypervisors (XenServer and Hyper-V will probably be the first if I can get them working off a USB bootable key drive). I also took the opportunity to add more memory (8GB total) to both the OpenSolaris server and the VM server (the HP ML115). While I was spending money, I also paid out for another 500GB external USB. This means I can now take a backup of the key filesystems (photos, documents etc) and ship them to an off-site facility (aka, my parents house).

Coincidently, T had filled up her C: drive with a huge number of photos and videos. Although the disk is backed up to an external drive, I wanted to move the data to the server. I created a new filesystem in ZFS:

# zfs create datapool/Users/teresa

This filesystem can grow and consume all space in the pool, so I assigned a quota of 30GB:

# zfs set quota=30G datapool/Users/teresa

In order to make this visible to T's Vista PC, I had to share the filesystem over SMB:

# zfs sharesmb=on datapool/Users/teresa

I made sure that T had a Solaris account setup with a password configured so it could authenticate and then mapped the network drive. The UNC path replaces the slashes in the filesystem with underscores: \\opensolaris\datapool_users_teresa

I copied T's documents to the server by changing the locations of the profile shell folders (right-click "Documents", "Pictures", "Videos" etc and select properties, then specify a new location and the contents are moved across - very easy).

It was then I found even more pictures that needed to move across and the 30GB I had allocated to the filesystem was going to be tight in the long term. This was trival to fix:

# zfs set quota=40G datapool/Users/teresa

The change applied instantly and the network drive size increased to 40GB.

It's good to have all our personal data now stored on the ZFS filesystem, with full mirroring, checksumming and backed up.

The now-redundant 500GB disks will be assigned to another blog post...

Friday, 2 January 2009

Backing up ZFS to an external USB drive

Having a resilient, snapshot managed storage server is all very well, but what happens if your server catches fire? While ZFS is very capable of preventing data loss, and the RAID capabilities compensate for a physical disk failure, the lack of a ufsdump/ufsrestore was a bit troubling.

I'm not claiming to have found the perfect solution, but a bit of playing around today with an external USB disk looks promising. I plugged the USB drive in and OpenSolaris automatically detected it. Running the format command showed it was mapped to c6t0d0.

I partitioned the disk to create a single 500GB(ish) slice 0 and created a traditional UFS filesystem on it. I'm sure I could have used ZFS, but wanted the simplicity of a single filesystem without worrying about pools or other volume manager artifacts.

After creating the filesystem with newfs, I mounted it to /mnt.

# newfs -m5 /dev/rdsk/c6t0d0s0
# mount /dev/dsk/c6t0d0s0 /mnt

I had a test filesystem created (datapool/testfs) and copied a file into it. I then took a snapshot of the filesystem:

# zfs snapshot datapool/testfs@mytest

I backed up the snapshot using the ZFS send syntax:

# zfs send datapool/testfs@mytest > /mnt/testfs.backup

This created a single file (/mnt/testfs.backup) containing the filesystem.

With that completed, I deleted the file I copied across. Now for the restore. This was very easy:

# zfs recv datapool/testfs.recover < /mnt/testfs.backup

A new filesystem was created and mounted in /datapool/testfs.recover, containing the file I wanted to recover which I could then copy back. To test a bit further, I destroyed the original datapool/testfs filesystem and all snapshots. I then did another zfs recv and specified the original filesystem name:

# zfs recv datapool/testfs < /mnt/testfs.backup

And it all came back perfectly!

Obviously this is a simple test and doesn't deal with incrementals etc, but should be sufficient for a keeping a copy of the data on an external disk that can be stored off site. Although I haven't tried, adding encryption to the zfs send pipeline should be very simple to do.

ZFS just gets better and better!

Tuesday, 30 December 2008

Building a SAN with OpenSolaris and ZFS

The one line summary: OpenSolaris and ZFS is very, very cool.

Having created a ZFS pool "datapool" consisting of two 500GB disks in a RAID1 mirror, I then created a few filesystems, including datapool/filestore which was to be the new fileserver. The whole process took two commands:

# zpool create datapool mirror c3d1 c4d1
# zfs create datapool/filestore

To make the new filesystem available over NFS to my Linux machine took another command:

# zfs set sharenfs=rw,anon=0 datapool/filestore

Okay, but what about the Windows box that doesn't support NFS natively? For this, I had to install the SMB server package (along with the kernel extension) and reboot the server. But after that it was simply a case of one more command:

# zfs set sharesmb=on datapool/filestore

The Mac has a very nifty backup tool called Time Machine. To use it you must directly attach a second hard disk, or tweak the configuration to allow for "unsupported" devices to work. I wanted to add in another hard disk to allow me to run Time Machine. Again, OpenSolaris/ZFS to the rescue.

I installed the iSCSI target server software (a couple of ticks in the package manager) and then ran the following commands:

# zfs create -s -V 100GB datapool/mac_backup
# zfs set shareiscsi=on datapool/mac_backup
# iscsitadm list target

The first command creates a "zvol" - a block device that is built from the zpool but does not have ZFS on it. The -s creates a sparse volume so that the space is not-preallocated. The second command makes the volume available over iSCSI, while the third command lists the available iSCSI targets so you can easily get the iSCSI address.

I then downloaded and installed the free globalSAN software for the Mac which provides an iSCSI initiator. Five minutes later (including a reboot of the Mac because it's another kernel extension), I had a new block device ready for partitioning in the Disk Utility. I created a Mac HFS journaled filesystem which Time Machine is able to use.

So one server can now provide simulateous NFS, CIFS/SMB and iSCSI to all my servers. It really is a small SAN at home!

Friday, 16 March 2007

ZFS and RAID levels

As a builder of Ingres systems, we tend to use RAID 1+0 (aka RAID10) for most of our systems. RAID5 is not recommended for databases due to the read-parity-write that is required for every write operation. Furthermore, the ability of a mirrored system to read two separate data blocks in parallel can give RAID1 a significant read performance advantage.

With the arrival of ZFS in Solaris 10, I've been reading up a little to see if this accepted wisdom changes with RAIDZ. A very interesting article (http://blogs.sun.com/roch/entry/when_to_and_not_
t o) basically explains that the read potential for a RAIDZ filesystem can be significantly less than that of a RAID10. However, for non-data filesystems (such as the checkpoint backup area), RAIDZ can provide some advantages. In these areas, disk I/O is less critical (the Ingres archiver writing data to the journals is performed asynchronously to a users query execution) and sequential write operations are handled better than random I/O, making it ideal for checkpoints and journals, but less good for data areas.

Will now be putting this theory into practice...